The spatial variability of subsoil properties constitutes a major challenge in both the design and construction phases of most geo-engineering projects. Subsoil investigation is an imperative step in any civil engineering project. The purpose of an exploratory investigation is to infer accurate information about actual soil and rock conditions at the site. Soil exploration, testing, evaluation, and field observation are well-established and routine procedures that, if carried out conscientiously, will invariably lead to good engineering design and construction. It is impossible to determine the optimum spacing of borings before an investigation begins because the spacing depends not only on type of structure but also on uniformity or regularity of encountered soil deposits. Even the most detail soil maps are not efficient enough for predicting a specific soil property because it changes from place to place, even for the same soil type. Consequently interpolation techniques have been extensively exploited. The most commonly used methods are kriging and co-kriging but for better estimations they require a great number of measurements available for each soil type, what is generally impossible.
Based on the high cost of collecting soil attribute data at many locations across landscape, new interpolation methods must be tested in order to improve the estimation of soil properties. The integration of GIS and Soft Computing SC offers a potential mechanism to lower the cost of analysis of geotechnical information by reducing the amount of time spent understanding data. Applying GIS to large sites, where historical data can be organized to develop multiple databases for analytical and stratigraphic interpretation, originates the establishment of spatial/chronological efficient methodologies for interpreting properties (soil exploration) and behaviors (in situ measured). GIS-SC modeling/simulation of natural systems represents a new methodology for building predictive models, in this investigation NN and GAs, nonparametric cognitive methods, are used to analyze physical, mechanical and geometrical parameters in a geographical context. This kind of spatial analysis can handle uncertain, vague and incomplete/redundant data when modeling intricate relationships between multiple variables. This means that a NN has not constraints about the spacing (minimum distance) between the drill holes used for building (training) the SC model. The NNs-GAs acts as computerized architectures that can approximate nonlinear functions of several variables, this scheme represent the relations between the spatial patterns of the stratigraphy without restrictive assumptions or excessive geometrical and physical simplifications.
The geotechnical data requirements (geo-referenced properties) for an easy integration of the SC technologies are explained through an application example: a geo-referenced threedimensional model of the soils underlying Mexico City. The classification/prediction criterion for this very complex urban area is established according to two variables: the cone penetration resistance qc (mechanical property) and the shear wave velocity Vs (dynamic property). The expected result is a 3D-model of the soils underlying the city area that would eventually be improved for a more complex and comprehensive model adding others mechanical, physical or geometrical geo-referenced parameters.
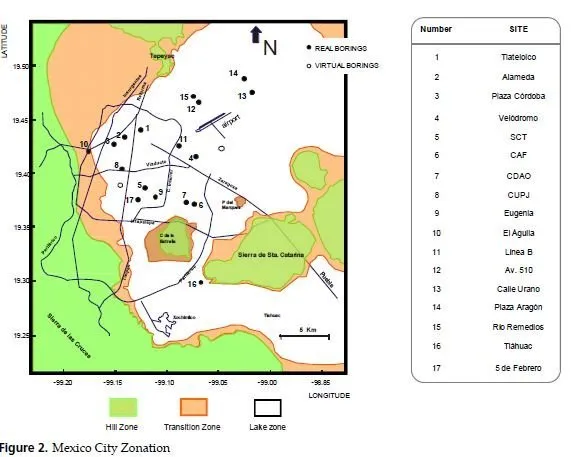
Cone-tip penetration resistances and shear wave velocities have been measured along 16 bore holes spreaded throughout the clay deposits of Mexico City (Figure 2). This information was used as the set of examples inputs (latitude, longitude and depth) → output ( qc / Vs ). The analysis was carried out in an approximate area of 125 km2 of Mexico City downtown. It is important to point out that 20% of these patterns (sample points and complete variables information) are not used in the training stage; they will be presented for testing the generalization capabilities of the closed system components (once the training is stopped).

In the 3D-neurogenetic analysis, the functions qc = {qc (X,Y,Z)} / Vs = {Vs (X,Y,Z)} are to be approximated using the procedure outlined below:
1. Generate the database including identification of the site [borings or stations] (X,Y geographical coordinates, Z depth, and a CODE ID number), elevation reference (meters above de sea level, m.a.s.l.), thickness of predetermined structures (layers), and additional information related to geotechnical zoning that could be useful for results interpretation.
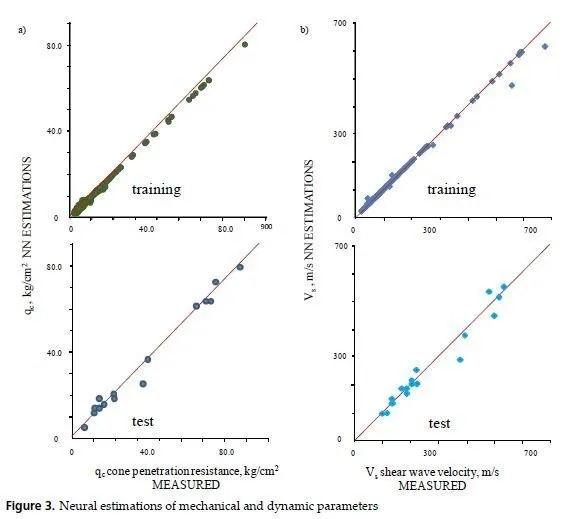
2. Use the database to train an initial neural topology whose weights and layers are tuned by an evolutive algorithm (see [46] for details), until the minimum error between calculated and measured values qc = fNN (X,Y,Z)} / Vs = { fNN (X,Y,Z)} is achieved (Figure 3a). The generalization capabilities of the optimal 3D neural model are tested presenting real work cases (information from borings not included in the training set) to the net. Figure 3b presents the comparison between the measured qc , Vs values and the NN calculations for testing cases. Through the neurogenetic results for unseen situations we can conclude that the procedure works extremely well in identifying the general trend in materials resistance (stiffness). The correlation between NN calculations and real values is over 0.9.

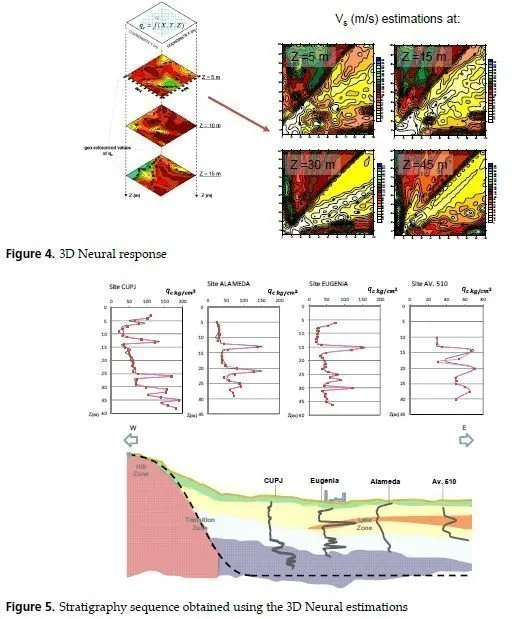
3. For visual environment requirements a grid is constructed using raw information and neurogenetic estimations for defining the spatial variation of properties (Figure 4).
The 3D view of the studied zone represents an easier and more understandable engineering system. The 3D neurogenetic-database also permits to display propertycontour lines for specific depths. Using the neurogenetic contour maps, the spatial distribution of the mechanical/dynamic variables can be visually appreciated. The 3D model is able to reflect the stratigraphical patterns (Figure 5), indicating that the proposed networks are effective in site characterization with remarkable advantages if comparing with geostatistical approximations: it is easier to use, to understand and to develop graphical user interfaces. The confidence and practical advantages of the defined neurogenetic layers is evident. Precision of predictions depends on neighborhood structure, grid size, and variance response, but based on the results we can conclude that despite of the grid cell (size) is not too small the spatial correlation extends beyond the training neighborhood, but the higher confidence is obviously only within.
