Source, path, and local site response are factors that should be considered in seismic hazard analyses when using attenuation relations. These relations, obtained from statistical regression, are derived from strong motion recordings to define the occurrence of an earthquake with a specific magnitude at a particular distance from the site. Because of the uncertainties inherent in the variables describing the source (e.g. magnitude, epicentral distance, focal depth and fault rupture dimension), the difficulty to define broad categories to classify the site (e.g. rock or soil) and our lack of understanding regarding wave propagation processes and the ray path characteristics from source to site, commonly the predictions from attenuation regression analyses are inaccurate. As an effort to recognize these aspects, multiparametric attenuation relations have been proposed by several researchers [47-53]. However, most of these authors have concluded that the governing parameters are still source, ray path, and site conditions. In this section an empirical NN formulation that uses the minimal information about magnitude, epicentral distance, and focal depth for subduction-zone earthquakes is developed to predict the peak ground acceleration PGA and spectral accelerations Sa at a rock-like site in Mexico City.
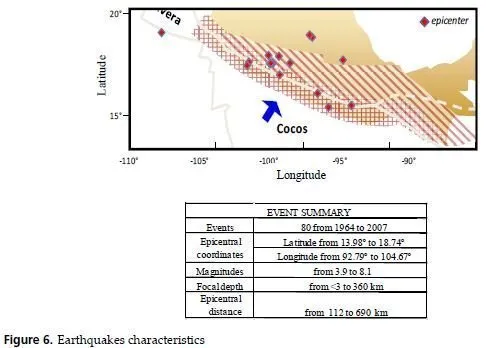
The NN model was training from existing information compiled in the Mexican strong motion database. The NN uses earthquake moment magnitude Mw , epicentral distance ED , and focal depth FD from hundreds of events recorded during Mexican subduction earthquakes (Figure 6) from 1964 to 2007. To test the predicting capabilities of the neuronal model, 186 records were excluded from the data set used in the learning phase. Epicentral distance ED is considered to be the length from the point where fault-rupture starts to the recording site, and the focal depth FD is not declared as mechanism classes, the NN should identify the event type through the FD crisp value coupled with the others input parameters [54, 47, 55], The interval of Mw goes from 3 to 8.1 approximately and the events were recorded at near (a few km) and far field stations (about 690 km). The depth of the zone of energy release ranged from very shallow to about 360 km.

Modeling of the data base has been performed using backpropagation learning algorithm.
Horizontal (mutually orthogonal PGAh1 , N-S component, and PGAh2 , E-W component) and vertical components ( PGAv ) are included as outputs for neural mapping. After trying many topologies, the best horizontal and vertical modules with quite acceptable approximations were the simpler alternatives (BP backpropagation, 2 hidden layers/15 units or nodes each).
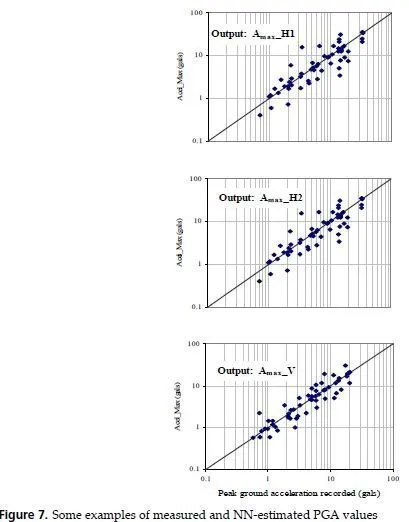
The neuronal attenuation model for {Mw , ED , FD} – {PGAh1 , PGAh2 , PGAv } was evaluated by performing testing analyses. The predictive capabilities of the NNs were verified by comparing the estimated PGAs to those induced by the 186 events excluded from the original database (data for training stage). In Figure 7 are compared the computed PGAs during training and testing stages to the measured values. The relative correlation factors ( R2 ï‚» 0.97 ), obtained in the training phase, indicate that those topologies selected as optimal behave consistently within the full range of intensity, distances and focal depths depicted by the patterns. Once the networks converge to the selected stop criterion, learning is finished and each of these black-boxes become a nonlinear multidimensional functional.
Following this procedure 20 NN are trained to evaluate de Sa at different response spectra periods (from T= 0.1 s to T= 5.0 s with DT=0.25 s). Forecasting of the spectral components is reliable enough for practical applications.

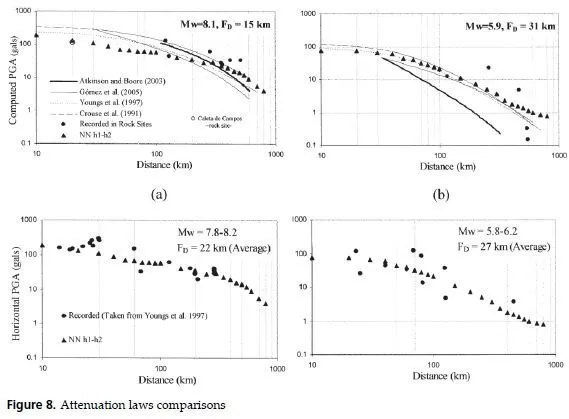
In Figure 8 two case histories correspond to large and medium size events are shown, the estimated values obtained for these events using the relationships proposed by Gómez, Ordaz &Tena [56], Youngs et al. [47], Atkinson and Boore [55] proposed for rock sites and Crouse et al. [51] proposed for stiff soil sites and the predictions obtained with the PGAh1-h2 modules are shown. It can be seen that the estimation obtained with Gómez, Ordaz y Tena [56] seems to underestimate the response for the large magnitude event.
However, for the lower magnitude event follows closely both the measured responses and NN predictions. Youngs et al. [47] attenuation relationship follows closely the overall trend but tends to fall sharply for long epicentral distances.

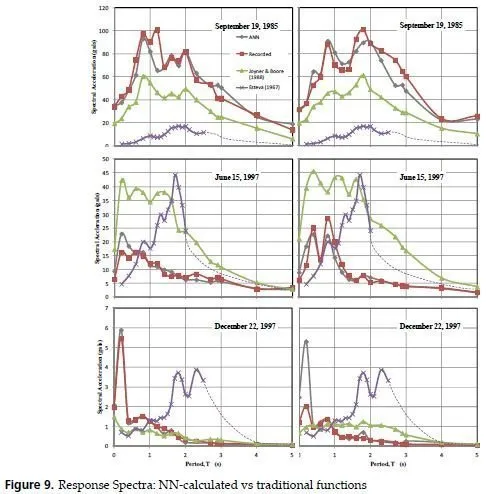
Furthermore, it should be stressed the fact that, as can be seen in Figure 9 the neural attenuation model is capable to follow the general behavior of the measure data expressed as spectra while the traditional functional approaches are not able to reproduce. A neural sensitivity study for the input variables was conducted for the neuronal modules. The results are strictly valid only for the data base utilized, nevertheless, after several sensitivity analyses conducted changing the database composition, it was found that the following trend prevails; the Mw would be the most relevant parameter then would follow ED coupled with FD . However, for near site events the epicentral distance could become as relevant as the magnitude, particularly, for the vertical component and for minor earthquakes (M low) the FD becomes very transcendental.

Through {Mw , ED , FD}ï‚® {PGAhi , Sa} mapping, this neuronal approach offers the flexibility to fit arbitrarily complex trends in magnitude and distance dependence and to recognize and select among the tradeoffs that are present in fitting the observed parameters within the range of magnitudes and distances present in data. This approach seems to be a promising alternative to describe earthquake phenomena despite of the limited observations and qualitative knowledge of the recording stations geotechnical site conditions, which leads to a reasoning of a partially defined behavior.