The seismic fragility of a structure refers to the probability that the Engineering Demand Parameter (EDP) will exceed seismic capacity (C) upon the condition of the occurrence of a specific Intensity Measure (IM). In other words, seismic fragility is probability of failure, Pf, on the condition of the occurrence of a specific intensity measure, as shown below:
Fragility=P [EDP>C|IM]
In a fragility curve, the horizontal axis introduces the IM and the vertical axis corresponds to
the probability of failure, Pf. This curve demonstrates how the variation of intensity measure
affects the probability of failure of the structure.
Statistical approach, analytical and numerical simulations, and the use of expert opinion
provide methods for developing fragility curves.
Statistical approach
With a statistical approach, a sufficient amount of real damage-intensity data after
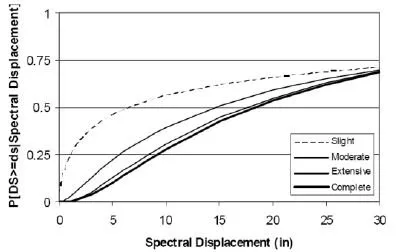
earthquakes is employed to generate the seismic fragility data. As an example, Figure 1 demonstrates the empirical fragility curves for a concrete moment resisting frame, according to the data collected after Northridge earthquake [20].

Figure 1. Empirical fragility curves for a concrete moment resisting frame building class according to the data collected after the Northridge Earthquake, [20].
Analytical approach
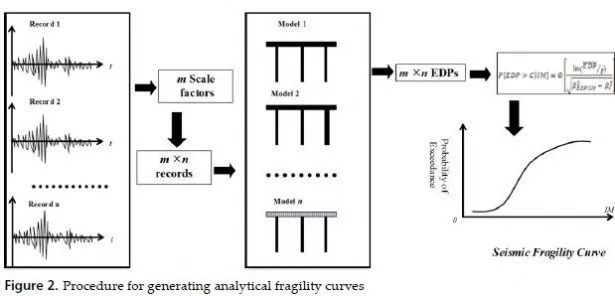
With an analytical approach, a numerical model of the structure is usually analysed by nonlinear dynamic analysis methods in order to calculate the EDPs and compare the results with the capacity to decide about the failure of the structure. The works in [21-24] are examples of analytical fragility curves for highway bridge structures by Hwang et al.
2001, Choi et al. 2004, Padgett et al., 2008, and Padgett et al 2008 .
Figure 2 demonstrates the steps for computing seismic fragility in analytical approach.
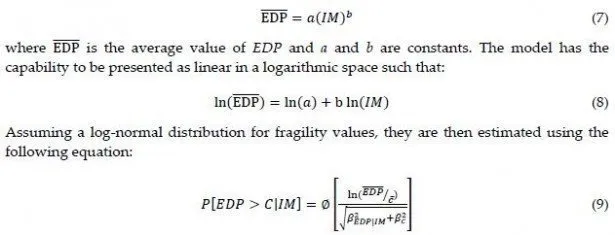
To overcome the uncertainties in input excitation or the developed model, usually adequate number of records and several numerical models are required so that the dispersion of the calculated data will be limited and acceptable. This is usually elaborating and increases the cost of the generation of fragility data in this approach. Probabilistic demand models are usually one of the outputs of nonlinear dynamic analysis. Probabilistic demand models establish a relationship between the intensity measure and the engineering demand parameter. Bazorro and Cornell proposed the model given below [25]:
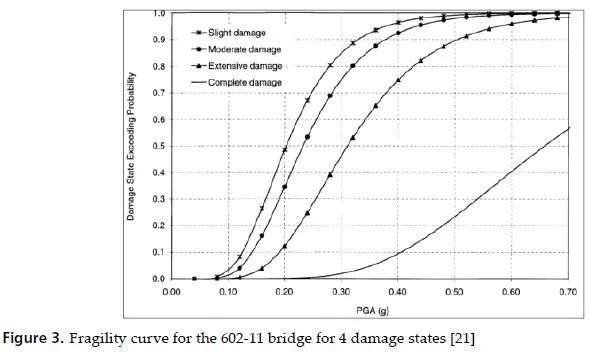
The parameter β introduces the dispersion in the resulting data from any calculations. An example of analytical fragility curves for highway bridges is shown in Figure 3.

Expert opinion approach
Given a lack of sufficient statistical or analytical data, expert opinion provides a valuable source for estimating the probability of the failure of typical or specific buildings for a range of seismic intensity values. The number of experts, their proficiency and the quality of questionnaires, including the questions, their adequacy and coverage, can affect the uncertainty of the approach and its results.

