The geometry, material, level of natural ground line, soil type, seismic event, and upper level of bedrock constitute the required input for each embankment and are addressed in the following sub-sections.
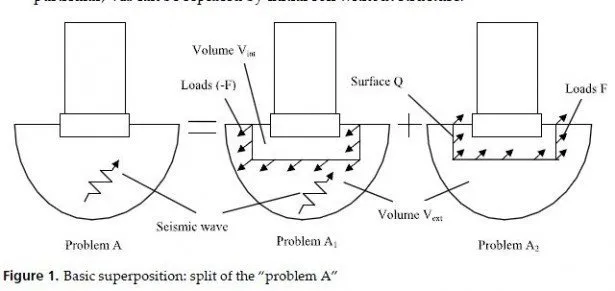
Geometry: The ideal case for obtaining the geometry of a given embankment is to carry out an on-site inspection. Should there be difficulties encountered in gathering such on-site information, however, the embankment geometry may be taken from the bridge plans. It is assumed that utilizing data from a finalized set of bridge plans will not affect the accuracy of the final seismic ranking and priority list for a given embankment case. Embankment slopes are assumed to be free of any evidence of impending failure, swampy conditions, or other terrain conditions that might be relevant to their stability. For a typically irregular slope, an idealization of the slope has to be performed in such a way that results in the lowest seismic slope stability C/D ratio. It is assumed that the material that might have been used for erosion protection of the slope will not greatly influence the resulting seismic slope stability, and therefore is not considered as an input parameter. The embankment slope geometry is identified by its height (H) and the idealized inclination (b) (Figure 1). The water table is assumed to be located below the embankment base in order to obtain the most critical seismic stability conditions. Analysis shall be carried out on both ends of each bridge and the most critical embankment slope at either end, which results in the lower seismic slope stability C/D ratio, shall be considered in the ranking analysis and priority list.
Materials, Natural Ground Line and Soil Properties: The soil profile at a bridge site is often composed of naturally deposited soils rather than controlled fill. The profile usually consists of multiple layers of different soils and the contact between softer foundations and stiffer bedrock soils is typically irregular. Defining the soil conditions at a site requires detailed site-specific sub-surface exploration that is not available at the majority of existing bridge embankment sites. Therefore, another approach is employed herein to specify the soil types and properties of applicable sites. It is assumed that any soil outside the embankment zone at a bridge site has uniform un-drained shear strength. The soil is considered to be in continuous contact with the bedrock layer, where the bedrock acts as a layer possessing high strength at some depth below the embankment.
Soil data is dependent on the level of the Natural Ground Line (NGL), shown in Figure 1. Both the Geologic Quadrant Maps of the United States that are provided in United States Geologic Survey (USGS) maps [2] and the Soil Conservation Service, Soil Survey maps that are reported by United States Department of Agriculture (USDA) [3] are used to identify the soil type underneath an embankment. The way by which either map is chosen is based on the level of the NGL as compared to the embankment base. Whenever the level of the NGL is above the level of the embankment base by more than 1.5 m. (5 ft), the analysis is solely based on the soil data obtained from the Geologic Quadrangle Maps of the United States, provided by USGS [2]. Otherwise, the soil data is derived from the Soil Conservation Service, Soil Survey, provided by USDA [3].
The dependency on the USDA maps in this case can be attributed to the fact that the top 1.5 m. (5 ft) soil can be accurately obtained from these maps. Shear strengths are assigned as done so by [4] for non-cohesive soil materials, which were derived from analysis of standard penetration tests (Table 1). When a range of values is given for the shear strength of a given soil, the lowest value is assigned to accommodate for the anticipated liquefaction potential at many bridge sites [5]. The shear strength assigned for cohesive soils in Table 1 is chosen after examining commensurately accurate un-confined compression data. Shear strengths assigned to the embankment fill are adjusted to reflect the cyclic loading effects between undrained failure for both cohesive and saturated cohesion-less soils, in addition to the intermediate behavior between drained and un-drained for dry and partially saturated soils. The density and shear strength of the embankment soils are conservatively estimated by assuming that marginal compaction may have occurred during construction. Should there be more accurate soil properties, they may replace those provided in Table 1.
Upper Level of Bedrock Layer: Data regarding the level under which a hard stratum, stiff bedrock layer, exists is not available for the majority of existing embankment sites;
especially for small bridges. An initial assumption of the upper level of this hard stratum is estimated from the Geologic Quadrant Maps of the United States [2]. The actual upper level of the stiff bedrock layer specifically falls within the range from the level of the embankment base down to the top level of the hard stratum. For the sake of seismic risk assessment of a bridge embankment, few upper levels of the bedrock layer within that range are considered.
Wherever the upper level of the bedrock layer is not known at a bridge site, the following three assumptions of this level are made, and the most critical case is considered in the ranking analysis: (1) at the same level of the embankment base; (2) at the bottom level of the lower soil layer, which is also the upper level of the hard stratum; and (3) at mid-height of the lower soil layer. Other assumptions of the top level of the bedrock layer may be considered if those assumptions yield a lower seismic slope stability C/D ratio. The top level of the bedrock layer, adopted in the ranking analysis, is the assumed elevation that results in the lowest seismic slope stability C/D ratio.

Seismic Event: The input Peak Ground Acceleration (PGA), which is the maximum bedrock acceleration at a designated embankment site, is obtained from seismic maps that are generated for specific seismic events. The choice of the seismic event is based on the importance and anticipated performance of the bridge as well as its geographic location on the seismic maps. The seismic maps to define the acceleration coefficient based on a uniform risk method of seismic hazard can be used. The probability that the acceleration coefficient will not be exceeded for a 50-year event is estimated to be 90%, with an expected return period is of 475 years [6]. Alternatively, seismic maps that may have been generated by State Departments of Transportation can be used. For the Commonwealth of Kentucky 50-year, 250-year, and 500-year seismic events were developed [7]. These events have a 90% probability of not being exceeded in 50 years, 250 years, and 500 years, respectively. All but four of the bridges and their embankments on priority routes in western Kentucky are required to withstand the 50-year and 250-year seismic events. The four other bridges are required to resist the 500-year seismic event.


