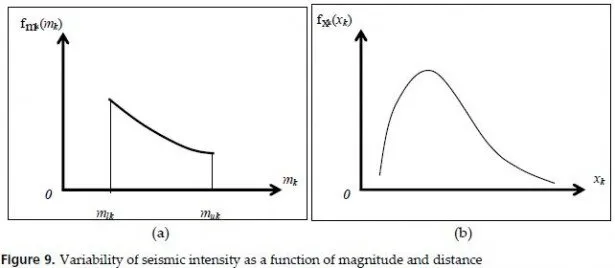
In an active area source, k, with a similar seismicity all across it, the seismicity data gives the maximum magnitude of muk and a minimum of mlk and the frequency of the occurrence of vk. Similar assumptions can be extended for a line source from which the Probability Density Function (PDF) of magnitude for a site, fMk(mk), can be constructed, as is schematically demonstrated by Figure 9.a [27].
if in the active zone under study, an area or line source can be assumed as a point, the probability density function of the focal distance of the site, x, fXk (xk) can be developed, as schematically demonstrated in Figure 9.b.
Ground motion prediction models
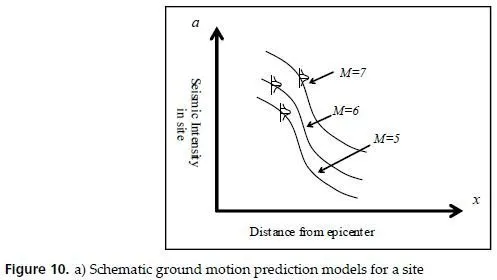
Ground motion prediction models – or attenuation functions – include the gradual degradation of seismic energy passing through a medium of ground up to site. The ground motion prediction models, schematically shown in Figure 10, have been provided according to the statistical data, characteristics of the ground, seismic intensity and distance, etc.
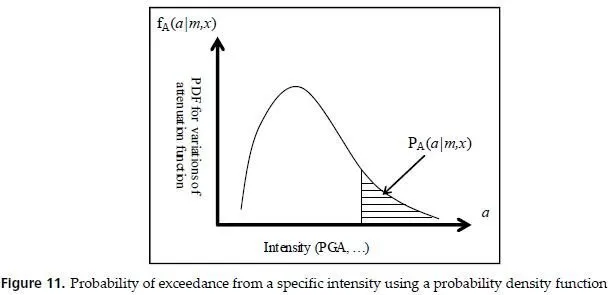
The ground motion prediction models are usually empirical relations, which do not match the real data exactly. The dispersion between the real data and the empirical attenuation relations may be modelled by a probability density function f(a|m, x) which shows the distribution density function of intensity a if a seismic event with a magnitude of m occurs at a distance x from the site. Figure 11 shows how f(a|m, x) changes when an intensity measure a varies.
According to the above-mentioned collected data, the annual rate of earthquakes with an intensity (acceleration) larger than a, v(a) can be calculated from the following equation:

Where, PA(a|mk, xu) stands for the probability of occurrence of an earthquake with an intensity larger than a at a site with an attenuation relation of fA(a|m,x).
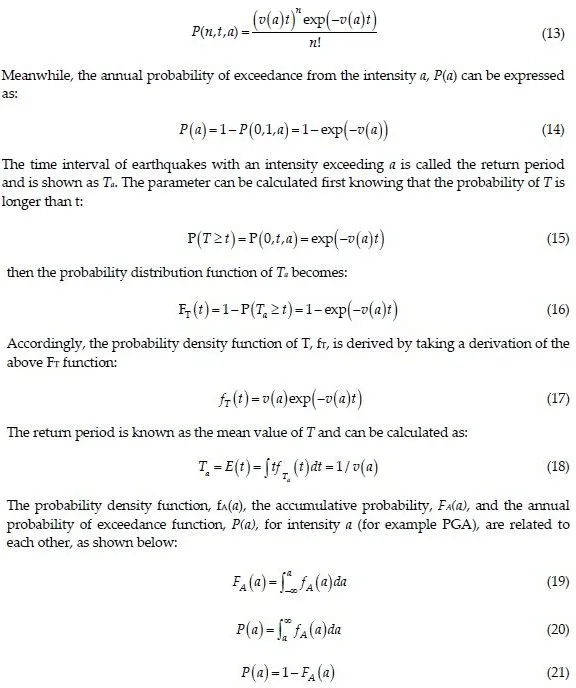
Poison process is usually employed to model the rate of the occurrence of earthquakes within specific duration. For an earthquake with an annual probability of occurrence of v(a), the probability of the occurrence of n earthquakes of intensity greater than a within t years is given by:
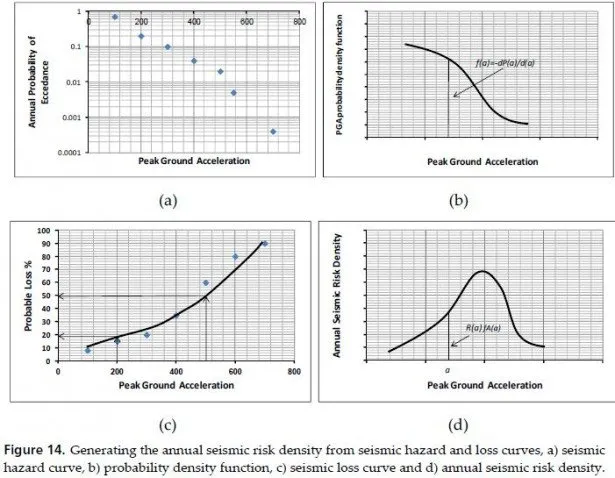
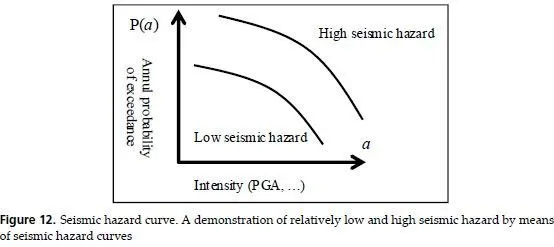
A hazard curve, as shown below, refers to a curve which relates the annual probability of exceedance of an intensity a, P(a), to the intensity value a. Two seismic hazard curves were employed in Figure 12 to schematically demonstrate two sites with relatively low and high seismic hazard.
A probabilistic hazard analysis for a site has resulted in the following plots of a probability density function and accumulative distribution.
