By applying the data available from seismic hazard and loss curves, an annual seismic risk density and seismic risk curve can be estimated.
A seismic loss curve is a useful tool for comparing the seismic capacity of different facilities.
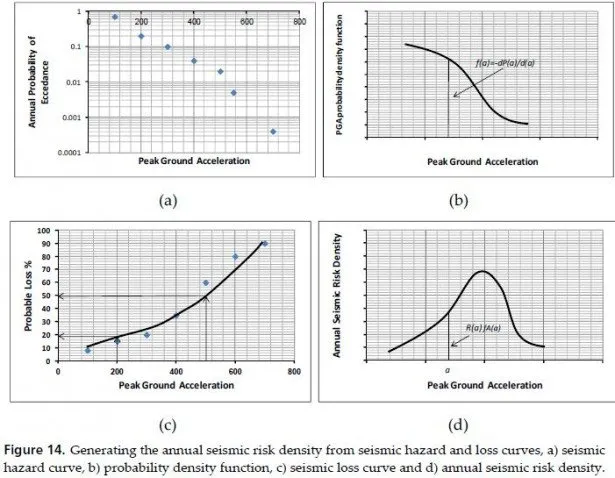
Seismic hazard and loss curves with basic information about the site and facility play a key role in the evaluation of seismic risk assessment and management procedures. The “annual seismic risk density” and “seismic risk” curves constitute two important measures which can be derived from the above data. The steps to obtain annual seismic risk density curves are shown in Figure 14. The probability density function for seismic intensity (e.g., PGA) is found using a seismic hazard curve using equations 18-20. Accordingly, the annual seismic risk density is derived by multiplying this result with the corresponding loss values, as shown in Figure 14.d below [27].

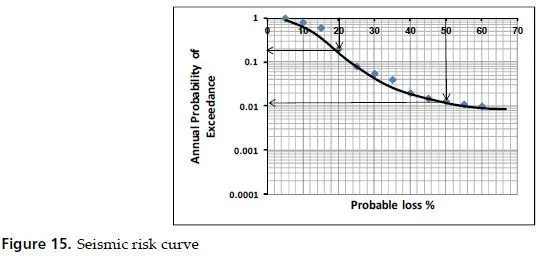
The seismic risk curve, as shown in Figure 15, is calculated using seismic hazard probability and loss values corresponding to similar intensities.
The seismic risk and annual risk density contain helpful information for risk management efforts. As an example, insurance premiums are calculated using this data for various seismic loss limits which can be decided by the client and insurance company.
