The expected risk of a project, assuming that the intensity measure as the seismic hazard parameter is deterministic, is calculated by equation 10, below:
R=PXL
where P is the probability of the occurrence of damage and L indicates the corresponding loss. The equation shows that any factor which alters either the probability or the value of the resulted loss affects the related risk. Diverse damage modes and associated loss values, Li (i=1 to a number of probable damage modes), with a different probability of occurrence, Pi, may be envisaged for a structure. The probable risk of the system, R, can be estimated as a summation of the loss of each damage mode:
![]()
Loss functions are usually defined as the replacement cost – corresponding to each damage state – versus seismic intensity. The loss associated with each damage mode, presented schematically in Figure 4, is usually collected through questionnaires, statistical data from post-earthquake observations or else calculated through numerical simulations. ATC 13 provides an example of the collection of earthquakes structural and human damage and loss data for California [26].
A summary of calculations required for estimating the risk of a project under a specific seismic intensity level may be illustrated by an “event tree” diagram.
Event tree diagram
An Event tree diagram is a useful tool for estimation of the probability of occurrence of damage and corresponding loss in a specific project due to a certain seismic event. The procedure requires information about seismic intensity, probable damage modes, seismic fragility values and the vulnerability and loss function of the facility under study.
As an example, suppose that partial seismic damage, structural collapse, partial fire and extended fire are considered to be the loss-generating consequents of an earthquake for a building. Figures 5 and 6 are the event tree diagrams, which demonstrate the procedure followed to calculate the corresponding risk for the seismic intensity of two levels of PGA=300gal and 500gal. To select the probability of the occurrence of each damage mode,
(i.e., the probability of the exceedance of damage states) the fragility curves can be utilized.
Each node is allocated to a damage mode. The probability of the incidence or non-incidence of each damage mode is mentioned respectively on the vertical or horizontal branch immediately after each node. The probability of the coincidence of the events at the same root is calculated by multiplying the probability of incidence of the events on the same root.
The final total risk, R, is then calculated as the summation of all Ris.
Figure 7.a demonstrates the distribution of risk values for different damage modes. In addition, it can be seen how increasing seismic intensity increased the risk of the project.
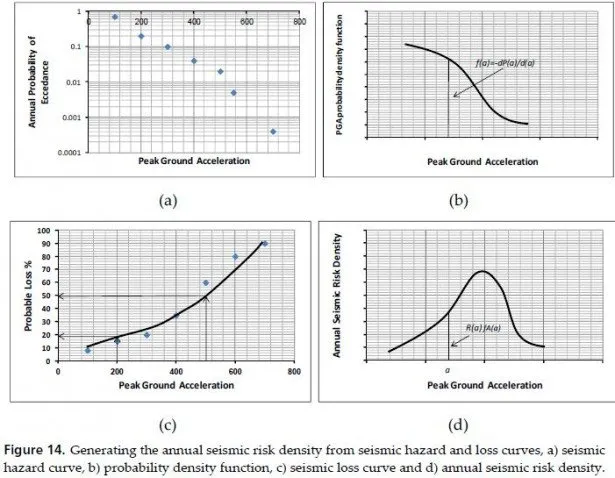
Figure 7.b shows the distribution of the probability of the occurrence of different loss values and how an increase of seismic intensity from 300gal to 500gal affects it in this structure. As mentioned, the calculations in an event tree diagram are performed for a special level of hazard. The curves present valuable probabilistic data about the points on the seismic loss curve. A seismic loss curve may be developed according to the information from event trees for a range of probable seismic intensities of the site. Figure 8 shows a schematic curve for the seismic loss of a project. The curve is generated by integrating the seismic risk values for each damage mode. It provides helpful data for understanding the contents and elements of the probable loss for each level of earthquake hazard.
The information provided by an event tree simply increases the awareness of engineers and stakeholders about the importance and influence of each damage mode on the seismic risk of the project and demonstrates the distribution of probable loss among them.
The total probable loss calculated by event trees provides valuable information for estimating the annual probable loss of facilities, as shown in the next part.


