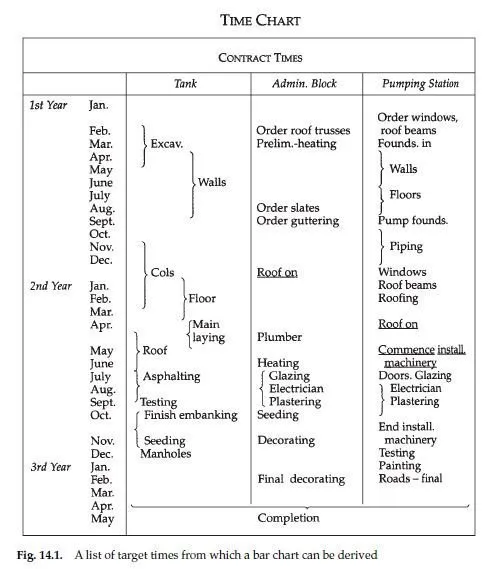
From the agreed programme it is useful for the resident engineer to draw up a list of dates by which different operations must be undertaken as shown in Fig. 14.1. If there are several contracts let for the construction of a project, the list will be essential for co-ordination of the work of different contractors. It is useful as an overall guide for checking if the contractor is keeping to time and as a reminder what future actions need to be taken.
Figure 14.2 shows a typical bar chart for a single structure. The length of the broad bands show the time duration expected for each operation; these are coloured or hatched in as work proceeds to show how much of an item of work has been completed. The solid black lines indicate the actual time periods taken to achieve the quantity entered in the broad band. Figures can be written in to show the quantity of work done by the end of each week, as compared
with the quantity planned to be done. Usually the planned output is shown in black, and the actual performance is entered in red.
A bar chart is easy to interpret, and keep updated. An agent will almost always have a bar chart pinned up in his office which his site engineer updates each day. The resident engineer will have one of his own, made up from the monthly measurements. The disadvantage of a bar chart is that it is difficult to apply to a complex project. The bar chart shown in Fig. 14.2 can only be meaningful in relation to one structure. If several structures are to be constructed under a project, it is not satisfactory to lump all their excavation,
concreting, brickwork quantities etc. together. However, if there are only a few structures to deal with, bar charts for each will be practicable.

An alternative is to use a computer to display bar charts at several levels of detail. For resource planning and material ordering purposes the detailed operations required for each structure can be shown on one chart, and these can be summarized into one bar on another bar chart, which in turn can be used to represent progress on the project as a whole. Critical linkages between operations can be fed into the program as for network diagrams (see Section 14.5 ), and the resulting critical paths and floats can be derived. Adjustment to a detailed bar chart perhaps due to some delay or extra work is automatically reflected in the overall summary bar chart display. Of course the operation of such software requires investment in the time and the use of skilled operators, so the cost may only be justified for a large complicated project.
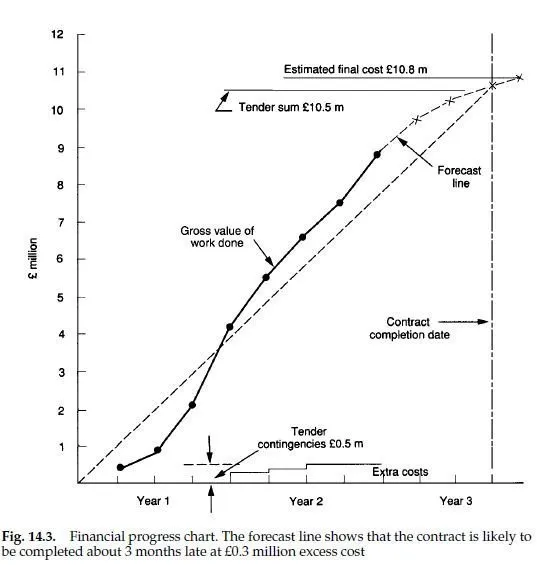
Another form of progress chart is to mark up the cumulative value of work done on a graph as illustrated in Fig. 14.3. However, to ensure that such a chart
does not give a false impression of progress the following adjustments are advisable:
The target cost should include the contingency money provided. Alower line at the base of the graph can show this contingency money and the expenditure against it, thus revealing where any exceedance of the target is due to excess contingency money spent.
If there is a major item of expenditure incurred late in the contract (such as for supply and installation of plant), the value of this should also be excluded, or be plotted separately as an additional line.
The cumulative valuations plotted monthly should not include retention money deducted, nor payment on account for materials on site, nor reimbursement of increased costs of wages and prices.
Although such a progress chart is not exact, it is a good indicator of progress.
Usually the plot of valuations forms an S-curve, having its steepest inclination during the central part of the contract period when productivity should be at its greatest. As a consequence, if the plotted line of valuations does not rise above the straight line sometime during the middle period of the contract, then almost certainly the contract will finish late.
One advantage of a progress chart of this kind is that, when an employer needs an estimate of future rates of expenditure, this can be estimated by sketching in an S-curve of the type shown and reading off the monthly rates of expenditure it implies, less any retention money held back.
Some standard conditions of contract, such as those of FIDIC (see Section 4.3) require the contractor to produce a cash-flow forecast along with his programme for construction. It must be remembered, however, that a cash-flow from interim payments does not necessarily represent construction progress, because deductions are made for retention and additions may be made for advance payments (if any), and materials delivered to site.
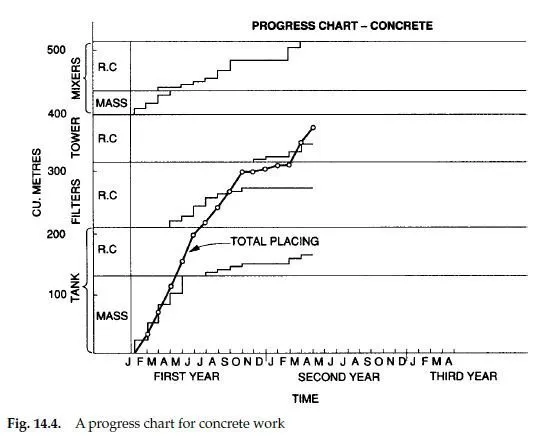
Similar types of cumulative output chart can be applied to specific types of work. One for concrete work to different structures is shown in Fig. 14.4. The horizontal bands show to scale the amount of concrete to be placed in each structure. The cumulative amount of concrete placed month by month can be plotted for each structure, and their total shown separately. Such a chart is useful for indicating where slow progress is occurring.
For a mainlaying contract the type of progress chart shown in Fig. 14.5 can be used. It is self-explanatory. The profile of the main may have to be shown in a condensed form; it also shows where specials are required.


