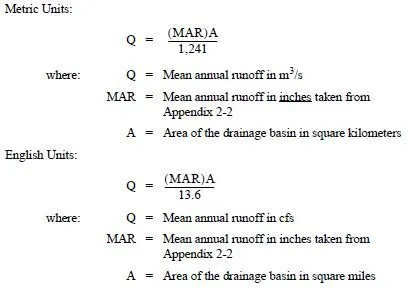
While measured flows provide the best data for design purposes, it is not practical to gage all rivers and streams in the state. USGS has developed a set of equations to calculate flows for drainage basins in the absence of a stream flow gage. The equations were developed by performing a regression analysis on stream flow gage records to determine which drainage basin parameters are most influential in determining peak runoff rates.
Estimates of the magnitude and frequency of flood-peak discharges and flood hydrographs are used for a variety of purposes, such as the design of bridges, culverts, and flood-control structures, and for the management and regulation of floodplains.
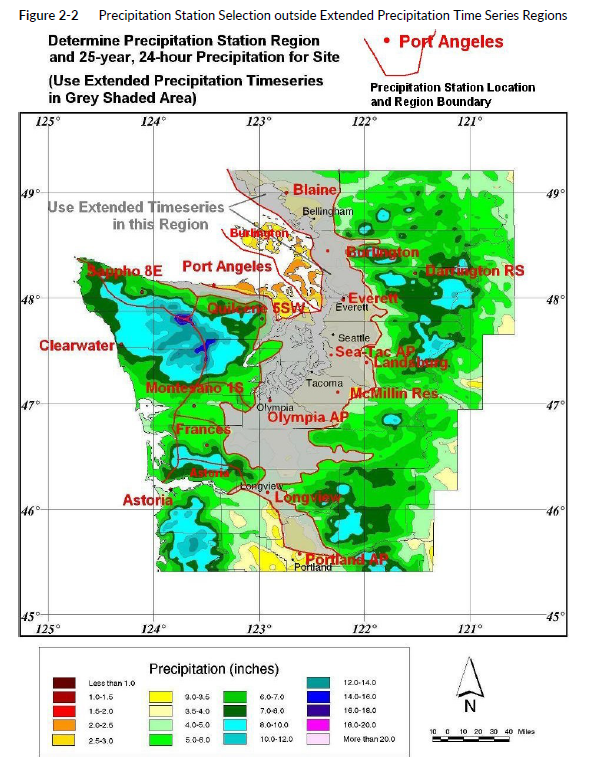
The equations divide the state into four hydrologic regions, as shown on the map in Figure 2-2. The various hydrologic regions require different input variables, depending on the hydrologic region. Input parameters that may be required include total area of the drainage basin and percentage of the drainage basin that is in forest cover. The PEO can determine these variables through use of site maps, aerial photographs, and site inspections.
The PEO must be aware of the limitations of these equations. They were developed for natural rural basins. The equations can be used in urban ungaged areas with additional backup data (i.e., comparing results to the nearest gage data for calibration and sensitivity analysis, field inspection of high-water lines, and information from local maintenance). PEOs should contact the RHE for further guidance. Also, any river that has a dam and reservoir in it should not be analyzed with these equations. Finally, the PEO must keep in mind that, because of the simple nature of these equations and the broad range of each hydrologic region, the results of the equations contain a wide confidence interval, represented as the standard error.
The standard error is a statistical representation of the accuracy of the equations. Each equation is based on many rivers and the result represents the mean of all the flow values for the given set of basin characteristics. The standard error shows how far out one standard deviation is for the flow that was just calculated. For a bell-shaped curve in statistical analysis, 68 percent of all the samples are contained within the limits set by one standard deviation above the mean value and one standard deviation below the mean value. It can also be viewed as indicating that 50 percent of all the samples are equal to or less than the flow calculated with the equation and 84 percent of all samples are equal to or less than one standard deviation above the flow just calculated.
The PEOs shall use the mean value determined from the regression equations with no standard error or confidence interval. The PEO shall validate the calculated flow rate based on collected field data and site conditions. If the flows are too low or too high for that basin based on information that the PEO has collected, then the PEO may apply the standard error specific to the regression equation accordingly. The PEO should consult the RHE for assistance.
StreamStats is another USGS tool that not only estimates peak flows but also can delineate the basin area and determine the mean annual precipitation as well as other basin characteristics.
