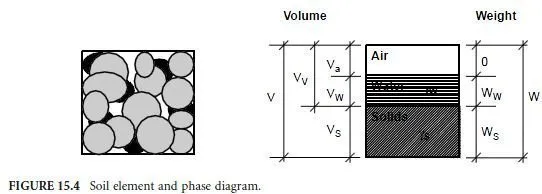
In a typical volume of soil the three components are arranged in a complex mixture. To visualize the relationships among the components when performing weight-volume or mass-volume calculations, drawing a phase diagram is recommended. Much like checking equilibrium with a free body diagram in statics, completing and balancing a phase diagram with numerical values of all quantities permits crosschecking the solution. Figure 15.4 shows an element of soil and the corresponding phase diagram. All solid particles in the element are taken as an equivalent single mass at the bottom of the diagram. Above the solids is the water also represented as a single equivalent mass and above that, the air. On the sides of the diagram are variable names; numerical values are entered here during calculations. On the left side are the total volume V, the volume of solids Vs, the volume of water Vw, and the volume of air Va. The combined volume of water and air is the volume of voids Vv . On the right side are shown the total weight W, the weight of solids Ws, and the weight of water Ww. The weight of air is negligible. For problems involving masses, mass values are shown on the right instead of weights and given the equivalent designations M, Ms, and Mw.
